
Fuel saving by wind energy in the UK
Fred Udo
Dec 20 2016.
To be published in Master Resource Jan 2017.
Introduction
The nominal fuel or CO2 savings through the use of wind power is calculated by multiplying the amount of kilowatt hours (kWh) wind power produced with the average CO2 emissions per kWh in the national grid.
In general the CO2 emissions in Europe are around 500 grams of CO2 per kWh.
No corrections on this result are ever mentioned in official policy documents..
In the Netherlands this simple calculation of the fuel saving by wind power is contested already a long time by some retired people with relatively high qualifications in technical and scientific fields. These authors seek to use only evidence extracted from real data recordings. The best examples are the publications in Energy and Environment [1] and in Euro Physics News [2]. The websites of the main culprits Kees le Pair [3] and Fred Udo [4] contain additional material.
Wind Power is supply driven and the storage of large amounts of electricity is impossible in most parts of Europe, so the integration of wind power into a distribution grid, which must balance supply and demand at any time, puts an extra stress on the existing power plants. This stress results in loss of efficiency. The analysis mentioned in Notes 1 and 2 points to yield losses, decreasing the nominal saving for the Dutch network by up to a factor of three.
The reply of responsible government officials and of the proponents of the wind-industry invariably tells that the losses are only a few percent. Sometimes hilarious arguments are put forward to deny the fact, that wind energy in large quantities causes near unsurmountable problems in the distribution grids.. Ref. [5] (in Dutch) describes how a cabinet minister solemnly expresses his preference for models rather than real data. A publication proving that wind power save a lot of fuel will be more than welcome in those circles.
This month, an article appeared [6] attempting to show from recorded data from the British grid, that savings due to wind energy are larger than the nominal saving calculated by DECC (Department of Energy and Climate Change). Thie name guarantees that the DECC figures will not be pessimistic for wind power, but this article presents evidence, that wind power in the UK saves even more fuel than the amount calculated from the simple calculation as described in the opening paragraph of this article.
The article is based on an analysis of market data. Those classical generators were isolated, which were used in order to compensate for variations in wind power.
The article shows that the calculated CO2 saving is larger than the nominal savings as calculated by DECC. This sounds incredible and it turned out to be so, because on closer inspection there is much wrong with the calculation of Thomson et al.
A. The data.
The wind production data is curiously not quoted in the article, so Table 1 is taken
from Wikipedia:
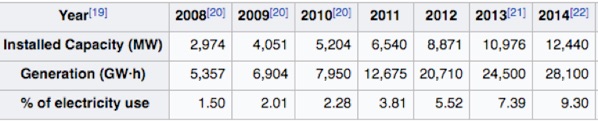
The first and most important objection is that the article uses only data from the
British electricity market between 2009 and 2014.
The table shows, that the wind power generation is less than 10% of the total demand during the period 2009 to 2014. The production was even less than 5% of the total electricity production during half of the period. The fuel savings from wind power are difficult to measure because they are obscured by the variations in CO2 emission by changes in the dispatch of conventional power plants.
The noise is greater than the signal the article aims to measure.
B.Dieselgenerators
In recent years, in England many diesel generators were installed to fill in power shortages during low wind periods. These generators do not fall within the boundaries of the electricity market, so, by definition, they are not considered in the CO2 calculation in the article.
C.Static power characteristics
The losses are calculated with the static fuel consumption curves of gas and coal plants. A publication on the Irish grid [7] shows that neglecting fuel consumption by power up/ down adjustment and operating as a spinning reserve gives an underestimate of 7% in fuel consumption.
The graph in the postscript of this article demonstrates this phenomenon.
-
D.Biomass
Part of the coal-fired plants are now fueled with wood. The article puts CO2 emissions from wood to zero despite the well founded objections to this clumsy way to replace coal. Therefore loss of efficiency of these plants does not count in the CO2 balance. This is an definition inspired by politics. Such considerations do not belong in an article that purports to give an objective presentation of a difficult problem.
-
E.All years count in the calculation.
The extra CO2 savings are calculated by adding up the savings of all years.
Table 5 of the article shows the reason behind this addition. For clarity the table is reproduced below.
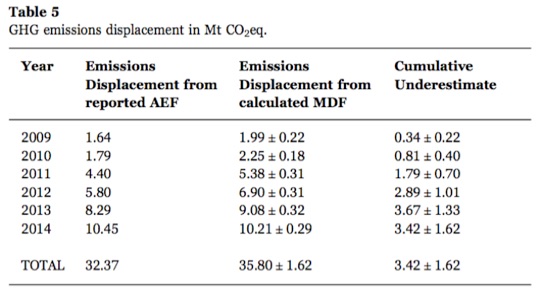
Column 2 shows the nominal saving calculated according to DECC.
Column 3 shows the CO2 saving calculated by the authors with a margin of error.
Column 4 shows the incremental difference between columns 2 and 3.
This is called the “Cumulative Underestimate” of the nominal saving.
Remark E1
The first row shows the calculated savings of the year 2009 to be 1.99 million tonnes. The contribution of wind was 2% in 2009, the CO2 saving is presented with an accuracy of 11%.
The noise due to variations in the demand and the dispatch is greater than the saving itself, so how can the specified margin of error be ten times smaller than the noise?
Remark E2
By comparing columns 2 and 3 we see that the authors calculate each year a CO2 saving which is larger than given by the DECC savings, except in 2014. In that year, the nominal savings (Mt 10,45) is larger than the calculation in the article (Mt 10,21). This is also the year with the most wind power, but the result of 2014 is contrary to the end result.
This unwanted number is masked simply by adding the results of all years together. Presented this way the savings calculated by Thomson et al are indeed larger than the nominal reduction (35.8 million tonnes versus 32.37 million tons).
This is bending the numbers towards the desired result.
Remark E3
In columns 3 and 4, the errors are not only very small, but they are equal in both columns. Furthermore the errors are added linearly within the columns..
This gives little confidence in the quality of the other calculations.
Conclusion
Thomson et al have not succeeded to prove, that wind energy in England saves even more fuel than given by the nominal calculation of DECC. The data presented points partially to the contrary. Calculation errors and the tendency to work towards a politically favoured statement make the article unthrustworthy. This article gives no evidence against the conclusions of existing literature that effective fuel saving by large quantities of wind energy are in absence of large scale energy storage a factor 2 to 3 lower than the nominal saving.
Of late there has been much discussion about the merits of Peer Review.
This article in a peer reviewed journal shows, that Peer Review is no guarantee for quality.
Post Scriptum.
The amount of wind power in the English grid before 2015 was too low to draw useful conclusions about its effect on the grid. Ireland is an ideal testing ground as the distribution grid is relatively isolated from its neighbours and the penetration of wind energy is much larger than in the UK. Moreover until recently the Irish operators (Eirgrid,SEAI) were relatively open about the operation of the grid with regard to CO2 emissions. The result was, that several publications could show, that wind power in Ireland is not terribly effective in saving fuel. See [8,9,11}
Recently another publication [10] appeared on wind power in Ireland.
Now the effects are large and easy to read from the statistics.
A quote:
Ireland increased it's wind generation by 1.11 between 2012 and 2013. This resulted in additional gas savings of 7%, a gas saving of 360 m3 per MW of wind installed during 2013.
Between 2013 and 2015 wind generation increased by a factor of 1.44. This resulted in additional gas savings of 16%, a saving of 160 m3 per MW of wind installed during 2014 and 2015.
This means that about double the wind farms had to be installed during 2014 and 2015 to achieve the same fossil fuel savings as in 2013.
End of quote.
A graphic illustration of the effects of wind power in Ireland comes from another analysis [11] of the Irish data from the same period:
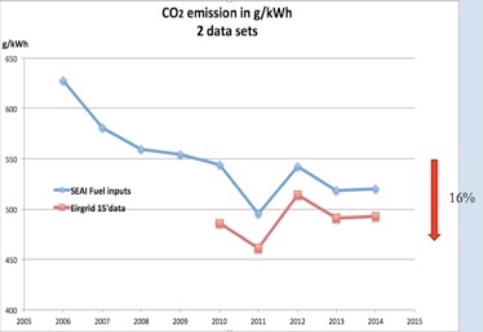
The graph shows the time evolution of the Irish CO2 emissions per kWh.
The difference between the blue and the red line is that the blue line is derived from data on fuel used, while the red line is calculated by Eirgrid using the static yield curves.
The difference is the 7% mentioned in section C.
The dip in 2011 is due to the commissioning of a large new CCGT, while the peak in 2012 is caused by the low price of coal [12].
The red arrow indicates the nominal effect of 16% wind power. The arrow shows, that the effect of inserting 16% wind power in the Irish grid is not visible in the time development of the specific CO2 emissions.
References.
1 F. Udo, C. le Pair, K. de Groot , A.H.M. Verkooijen and C. van den Berg
Energy and Environment 26 no 8 2015.
http://www.clepair.net/windbesparing.html
2C. lePair, F. Udo & K. de Groot
EuroPhysics News April 2012.
http://fredudo.home.xs4all.nl/Zwaaipalen/Europhysics_News.html
4 http://fredudo.home.xs4all.nl/Zwaaipalen/Titelpagina.html
5 Hoe minister Kamp water kookt
http://fredudo.home.xs4all.nl/Zwaaipalen/Hoe_min_Kamp_water_kookt.html
6 R. Camilla Thomson⁎, Gareth P. Harrison, John P. Chick
Marginal greenhouse gas emissions displacement of wind power in Great Britain
Energy Policy 101(2017)201
http://www.sciencedirect.com/science/article/pii/S0301421516306036
7 Analysis 2012 SEAI report
http://fredudo.home.xs4all.nl/Zwaaipalen/SEAI_report_2012.html
8 F. Udo
Wind Energy in the Irish power system
http://www.clepair.net/IerlandUdo-e.html
9.J.B. Wheatley - Quantifying CO2 savings from windpower;
Energy Policy, 2013, vol. 63, issue C, pages 89-96
http://www.sciencedirect.com/science/article/pii/S0301421513007829
10 Owen Martin The Reduction in Gas Savings Due to Wind Energy 2012 to 2015
http://irishenergyblog.blogspot.ie/2016/05/new-report-gas-savings-2013-to-2015-due.html
11Fred Udo and Patrice d’Oultremont
http://fredudo.home.xs4all.nl/Zwaaipalen/SEAI_report_2012.html
12Both observations are copied from year reports of SEAI and Eirgrid.