
Using Wind Energy to save fuel and reduce CO2 emissions.
F. Udo, C. le Pair, K. de Groot , A.H.M. Verkooijen and C. van den Berg
July 29 2014
Published in Energy and Environment 26 no 8 2015
Summary
The official Dutch green energy policy aims at increasing the total wind turbine capacity in the Netherlands to 10,5 Gigawatts. This paper analyses the possible fossil fuel savings due to the resulting contribution of 25% wind to the national power grid. The effects of curtailment, grid accommodation losses and self-energy are discussed.
It is shown from performance data that these three factors reduce the fuel saving due to wind energy to less than 38% of the nominal saving. They effectively reduce the planned wind contribution from three to just over one percent of the country’s energy consumption.
1. Introduction
In a former paper [1] we enumerated 9 factors that influence the saving of fossil fuel due to large-scale implementation of wind energy. Existing literature uses only model data to calculate this saving. The reason is, that fuel input data for power production required to measure the conversion efficiency of conventional generators are not made public. This paper uses among others data that recently became available in Ireland and Spain. The text is based on an unpublished discussion in Dutch [2].
In first approximation fuel savings and CO2 emission reduction go in parallel.
Gas and coal differ in the amount of CO2 emitted per unit of heat produced. This difference is taken into account where needed.
Following EU- agreements, the Dutch government assumes that every kWh of wind-generated electricity saves the fuel necessary to generate 1 kWh of fossil fuel generated electricity. This is only true when the contribution of wind energy is very small. It certainly does not hold when the wind penetration reaches the goal of 25%.
The government stated to Parliament in 2013 that the saving might be approximately 3% lower because of losses [3], although in an earlier discussion it was admitted to parliament that 5,1 % of the saving was lost [4] The KEMA, the research institute founded by the Dutch electricity industry, did a study of such losses. The study [5] concluded:
“The loss is possibly 10% of the amount of CO2 emission you hope to save”.
The difference between the official EU figure of 0% loss, the 3 to 5% loss quoted by the Dutch government, the 10% quoted by the experts of KEMA and the 100% loss calculated by one of us (CleP [6]) is certainly a reason for grave concern.
This paper aims to provide more information on this subject.
2. Windenergy, a supply driven commodity.
Wind turbines can be added to the existing system of electricity production, but they cannot substitute fossil fuelled generators.
The following examples serve to illustrate this statement.
A.During several weeks a year all wind turbines in West Europe together produce only a few percent of their nameplate capacity. This fact has been neglected so far in the public debate, because conventional fossil or nuclear units fill the gap. On the other hand, a black out anywhere is front-page news. Wind power cannot deliver electricity on demand, so it requires large-scale storage or back up. Large-scale energy storage is not available to the Netherlands, so a 100% back up system remains essential to guarantee an equilibrium between supply and demand at all times.
B.By law, renewable energy has absolute priority in the merit order on the electricity market. This has some unintended consequences. As soon as wind supplies on average more than a few percent of the electricity demand, a high wind speed causes the electricity price to fall significantly. In 2010 the Dutch ‘Central Planning Bureau’ coined the word “profile effect” for this phenomenon. This profile effect is significant already in the North-West European electricity market. As a consequence a significant number of conventional power plants have been mothballed or decommissioned. Wind energy disturbs the operation of the market and it affects the necessary investments in conventional production capacity [7] .
In September 2013 forty (!) organisations in the Netherlands signed a so-called Energy Agreement, which when fully implemented will allow the country to comply with the EU requirement to supply 16% of the Dutch energy consumption from renewable sources by 2023. In the EU definition hydro, solar, wind, wood pellets (!) and other biofuels qualify as such. This Energy Agreement forces the government to supply € 18 billion in exploitation subsidies for future offshore wind turbines. The amount does not include the € 5,5 billion already committed for the exploitation of previously planned and existing offshore wind farms. The € 23,5 billion subsidy will be generated by a levy on the price to be paid by the electricity consumers during 15 years.
When so much money is at stake, it is essential to know to what extent the reduction in fossil fuel consumption and CO2 emission is actually achieved.
We also note that the societal cost of building thousands of turbines on land and off shore is nowhere mentioned in the Energy Agreement.
3. The total amount of wind energy produced.
Table 1 shows the energy balance for the Netherlands [8].
Table 1
Present situation (2011)7. 1 PJ = 1015 Joule
Dutch energy consumption 3245 PJ
Dutch electricity use 422 PJ
Wind electricity production in 2023a) 104 PJ
The wind contribution in 2023 is
(assuming the same energy consumption as in 2011):
Of the electricity consumption 25%
Of Dutch energy consumption 3,2%
a) The wind electricity production in 2023 is calculated for 6 GW on land with a capacity factor (CF) of 25% and 4,5 GW off shore (CF 40%).
If the turbines would perform as the government expects, they will contribute 3,2% of all energy used in the Netherlands, but only 0,8% of the energy we use and process.
Data has become available about three factors, which decrease the savings expected by the addition of wind energy. These effects will be discussed in sectors 4,5 and 6 on the basis of real performance data, not model predictions.
4. Oversupply of wind electricity.
The Netherlands is in an unfavourable situation, as it lacks the relief required for hydroelectric generation and storage. This technology is at present the only economical large-scale storage and buffering option for (excess) wind electricity. Alternative ideas for wind energy storage, such as the plan to build a large artificial reservoir in the IJsselmeer (inland lake), or a giant hole surrounded by dikes in the North Sea, both with windmills on the dikes and hydro driven generators in the dikes, have never left the drawing board because of the excessive costs for these systems. The second option, export of the excess electricity, will be blocked in the coming years as all surrounding nations are also investing heavily in wind energy. The wind strength in NW Europe is strongly correlated, so an oversupply in Holland will more often than not coincide with oversupply in Germany, Belgium, Denmark and Great Britain. Therefore, when a 10,5 GW wind capacity is placed in Holland, we must solve our own problems. KEMA came to this conclusion already in 2010 [10]
The issue of wind oversupply has been recognised some time ago. The Delft University Wind Energy Study Team has looked at it in 2008. In 2009 the magazine “De Ingenieur” gave a review[11] of Dr Ummels’ thesis, and noted that large-scale fitting-in of wind energy in the Dutch grid would present no problem. This is not correct according to the data presented below.
The ‘power duration curves’ in figure 1 are taken from the thesis of Ummels, with an additional horizontal line at the 10 GW power level.
Figure 1: Power duration curves with different wind power capacities
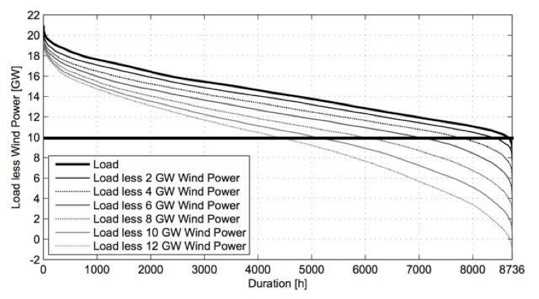
The upper curve is the electric power demand curve, constructed for the Dutch electricity demand in 2005 on an hourly basis. So, for example, it shows that in the country there are one thousand hours each year with an electricity demand of 17.8 GW or more.
The lower curves are constructed by subtracting for each of these hours the amount of wind electricity fed to the grid when the indicated amount of wind turbine capacity is present ( 2,4,6, etc. GW installed). The wind electricity production has been calculated using the wind force data for the year 2005 for each hour, as provided by the Dutch Meteorological Institute. Please note: points on each curve that lie vertically aligned are not necessarily measured at the same point in time, as the force of the wind is uncorrelated to the demand.
A constant base load or must run level is represented by a horizontal line in the figure.
The question to be answered is: what will be the size of the “must run” power of the Dutch (fossil and nuclear) power stations. This the minimum power below which the electricity demand minus wind electricity supply cannot drop, in order to keep the generators ready to deliver. The answer of the wind industry is: “ The must run power will be reduced to a level to keep the losses at a negligible level”
The power duration curves in figure 1 show that a must run level of 10 GW indicates that significant wind electricity oversupply will occur. Integration of the “12 GW wind” curve under the horizontal 10 GW line shows, that the curtailment (production cut) will be some 40%. Thus 40% of the total yearly wind production cannot be accommodated in the Dutch grid. If we would be able to reduce the “must run” capacity to 5 GW, then the curtailment drops to 10%.
The actual “must-run” power level is difficult to determine, as this depends on the state of the electricity market.
KEMA studied the issue of incorporating wind supply in 2010 at the request of the General Energy council AER and the power companies Delta, Essent, Eneco and Nuon. They concluded that at 9 GW wind capacity 1,5 TWh (5,4 PJ) is lost every year, and at 12 GW wind ditto 5 TWh (18 PJ).
Interpolating linearly, we find the loss at 10,5 GW wind power to be 11,7 PJ per year. According to table 1 10,5 GW wind power yields 104 PJ, so that 11% of the wind power production is lost per year.
Figure 2 is taken from a study of the Irish electricity generation [12]. The graph is based on actually measured wind curtailment as a function of the wind electricity production expressed as a fraction of the total generation.
Figure 2.
Wind curtailment data for Ireland.
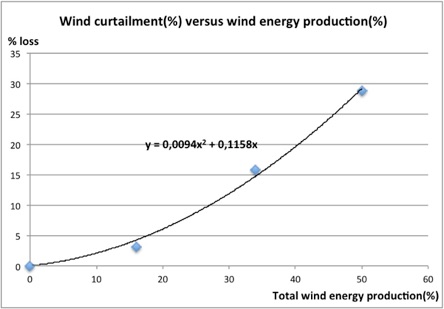
EirGrid data also allowed the calculation of the Irish must-run capacity, which was found to be 1,3 GW. The Irish mix of fossil fuels is comparable to that in Holland, but Ireland has no co-generation (of heat and power). It is used extensively in Holland in greenhouses and in industry.
The Dutch electricity demand is five times the Irish, thus other things being equal the must-run capacity is 5 x 1.3= 6,5 GW. To this must be added the nuclear capacity of 0,7 GW and part of the 7 GW co-generation capacity. We therefore set the must-run capacity in Holland at 8 to 9 GW.
We conclude that the amount of curtailment of wind energy in the Netherlands in 2023, if the plans become reality, will be at least 10%.
5. Conversion efficiency losses caused by wind electricity
The simplest method to calculate the total CO2 emissions from power stations is to take the actual fuel consumption of each power station and dependent on the fuel type, convert these numbers into CO2 emissions. Since the liberalisation of the electricity market, these numbers are no longer available to the public, because this is competition sensitive information. This data would allow an accurate determination of the effects of adding wind and other non-demand driven electricity supply sources to the Dutch grid. The best one can do at the moment is to estimate the size of this effect, based on experience presented in refs 14 and 17.
The Irish grid operator derives the fuel consumption from the amount of electricity produced by the relevant power stations, taking into account the efficiency achieved by each station as a function of actual capacity fraction utilized in a certain time slice. EirGrid takes the efficiency data measured at a constant rate and does not include the efficiency loss caused by load following and start-stop operations. It also neglects the fuel use of the “spinning reserve”. Shortcomings of this approach have been reviewed elsewhere
The following paragraphs discuss the approaches taken in three different countries to estimate the effects of adding wind energy. Please note that accommodation losses are sharply increasing with increasing wind contribution, so the results represent lower limits of the losses, if the contribution of wind was smaller than 25%
5.1 Spain.
Gutiérrez et al [14] published a paper on the accommodation of wind electricity in the Spanish grid. They followed the method of EirGrid as described above to calculate the fuel use. In the year 2011 wind supplied 42000 GWh or 14,7% of the electricity generated in Spain. Not all Spanish power stations were ramped up and down to accommodate the varying wind contribution. The ones used for load following generated 62% of the Spanish production.
From the data of Gutiérrez et al we derive the following numbers:
1.The CO2 emission of the system fossil plus wind is 87,2 Megaton (Mton).
2.Fossil and wind combined generate 151300 GWh
3.If this amount of 151300 GWh would be fossil generated, it would cause 97,6 Mton CO2 emission according to generator data from ref 16.
4.The CO2 saved by 42000 GWh wind amounts to 97,6-87,2 = 10,4 Mton or in other words:
5.The CO2 emission per kWh generated is 246 g/kWh
This is less than 50% of the CO2 saving expected in the case only gas was used to balance wind.
5.2Ireland.
EirGrid provides detailed figures about the electricity production per 15 minutes time interval: total demand, CO2 emission, and fossil and wind production. In 2011 wind generated 15% of the total demand. EirGrid derives the fuel consumption from the (amount of) electricity generated and the power dependent efficiency of generators working at a constant fraction of their maximum power. This allows the calculation the efficiency of replacing fossil by wind. This has been done in two papers, both using the data over 2011.
Udo [15] shows that the efficiency of the wind contribution varies from 40% to 100%, dependent on the availability of hydropower (for back up and storage) in the system. The average efficiency over 2011 is 70% in this analysis, a 30% loss compared to the calculation according to the EU method.
Wheatley [16] made a more extensive analysis of the Irish system over this same year. He also collected data on the actual fuel consumption of the power generators. Quote:
“Based on an emissions model and 1/2-hourly generation time-series for each grid connected thermal generator, it is shown that wind power saved 0.28 tonCO2/MWh on average, relative to an average carbon intensity in the absence of wind of 0,53 ton CO2/MWh.” Unquote.
The relative efficiency calculated by Wheatley is thus 0.28/0.53 = 53%, resulting in a loss of 47%. As this figure is derived from actual fuel consumption data, it is closer to reality than the result quoted in ref 17.
5.3Colorado
The Bentek study on the Colorado power system: “How less became more” [17] is based on the official emission data of the American Environmental Protection Agency (EPA) in the period before and after the construction of wind parks. The study compensates for import and export of electricity across state boundaries. In the case of coal fired power stations providing the back up for wind they find that the total CO2 emission with wind power is higher than without the turbines.
We conclude from these three studies that the amount of fuel and thus CO2 emission saved is at most 50% of what the wind proponents state. This is still optimistic for the Dutch situation in 2023: A system with 25% wind electricity without hydro and without export or import possibilities.
6.Self-energy of wind turbines
The economic lifetime of a turbine is set at 15 years due to the Dutch subsidy policy. The time for recuperation of self-energy – the energy required for building and erection the turbines- must be related to this period. The wind turbine industry admits that a turbine must work for 6 months to produce this energy. Calculations by others with less of a stake in the industry find higher numbers.
6.1J. van Oirschot, M.Sc. , Director R&D of the Dutch construction firm Volker Wessels Stevin, involved in positioning and building foundations for the turbines, calculates that it takes 1,5 years to reclaim the energy involved in building and installation [18].
6.2Udo [19] calculates that a turbine with a 25% capacity factor requires 11.5 months for this. The calculation is based on data from a study done in Sydney.
We will take the lowest value from these two, a reclamation time of 1 year, which means a yearly loss of 7% over the 15 year write off period for turbines.
7. The three effect combined on the reductions of the fuel and emission savings
In summary the losses in the Dutch grid when accommodating 25% wind electricity are as follows:
Curtailment is sheer loss, so the wind production reduces by 10%. The remainder must be accommodated in the grid at a loss of 50%, so the fuel saving is 0.5 x 0.9 = 0,45 of the expected value.
The 7% self-energy must be subtracted from the fuel saving after accommodation in the grid.
The three factors together reduce the effective fuel saving to 38% of the official fuel saving.
8 Discussion
Whenever there was a range of possible outcomes in the foregoing calculations, we have erred on the side most advantageous for the wind industry. In addition, no account was taken of the following factors because of lack of data:
•Building and placing wind turbines are not the only activities and installations taking energy. The extra grid adaptation and high voltage connectors cost energy. These activities are so complex and costly, that the implementation of these adaptions is years behind schedule in Germany. Data on the magnitude of this energy expense are lacking, but we guestimate that an energy expense comparable to the turbine self-energy is involved.
•When turbines are not producing, they still require energy. This became dramatically clear in Germany, where offshore wind turbines urgently needed current supply from diesel generators in the period before the power connections to shore were ready. It is unknown how significant this energy consumption is.
•In sections 5.1 and 5.2 the fuel consumption of back up power stations has been derived from the power production and the performance curves of the generators involved. Thus efficiency losses during ramping the generators up or down have not been accounted for, nor the effect of the fuel consumption when the generators act as spinning reserve.
•The official Dutch capacity factors for the turbines, Cf = 0,25 onshore and Cf = 0,40 offshore are too optimistic. In 2010 all existing Dutch wind turbines onshore and offshore together had a capacity factor of 0,23. Turbines have planned and unplanned unavailability, and the total unavailability goes up with age. This manifests itself as a diminution of the production with age. Recent work has determined the production loss with age as -1,6% +/- 0,2% per year [21]. This factor diminishes the total production over the economic lifetime of 15 years by 10%. After 15 years of operation the yearly output is diminished by 22%.
•Maintenance costs energy too. A calculation is reported in the ECN study of O&M costs of wind energy at sea. The result is, that maintenance costs 85 million euro/year for 520 MW installed. With a Cf = 0,40 maintenance costs amount to 45 euro/MWh generated. A significant part of this money is spent on energy. It is noted, that the maintenance cost of wind turbines at sea is larger than the market value of the generated electricity.
•The wind electricity generated offshore must be transported over much larger distances than is customary for the existing (onshore) power plants. This causes extra power loss in cables and transformers; even when direct current is used, as this technique needs two conversion stations with transformers, valves and filters.
Taking all these factors together the actual fuel saving will be less than one third of the expected saving. This means that in 2023 the effective wind contribution to the total Dutch energy consumption will be around 1% instead of 3%.
A transformation of our electricity supply system is in the long run unavoidable. However, the direction chosen by the Dutch government in the recent Dutch Energy Agreement is inefficient and expensive, as it focuses on subsidizing the exploitation of old fashioned techniques. It does not facilitate possible future developments like fission reactors based on Thorium and it forgets to promote the existing combined electricity and heat generation.
This article shows, that building wind turbines without means to implement the intermittent production achieves a CO2 emission reduction that is significantly lower than claimed.
The price Dutch society will pay for saving a small amount of fossil fuel and CO2 emission through wind turbines will be at least three times higher than officially stated.
References and notes
-
1. C. Le Pair, F, Udo and K de Groot: Wind turbines as yet unsuitable as electricity providers.
Europhysics news 43 (2012) nr 2 http://www.clepair.net/europhysics201203.html
2. De besparing van brandstof en CO2 uitstoot door Windenergie.
http://www.clepair.net/windbesparing.html
-
3.Letter Min. Econ Affairs dated 29 nov. 2011 to C. le Pair. Minister Kamp in Tweede Kamer:
(chamber of deputies) year 2010-2011, appendix, nr. 2815; year 2010-2011,
appendix nr. 3440; year 2012-2013, appendix, nr. 474.
-
4.Ms. M. v.d. Hoeven in Tweede Kamer year 2009-2010, appendix, nr. 1574. (‘At 33,3% less conventional
power 31,6% less fuel use’, i.e. loss 5,1%.)
-
5.Chr. Herwicker, KEMA, in de Volkskrant 2010 05 01: “the loss is possibly 10% of the gain.” Via link in:
http:// www.clepair.net/recent/winderigevolkskrant.html
-
6. C. le Pair: Facts about the savings of fossil fuel by wind turbines in The Netherlands
http://www.clepair.net/recent/winderigevolkskrant.html
The data for this article are extracted from a paper by the same authors in Dutch
http://www.clepair.net/windbesparing.html
-
7. Traber and Kernfert Gone with the wind? Market prices with increasing wind energy supply.
Energy Economics, 2011, vol. 33, pages 249-256
-
8.G. van Schoonewelle: Energiejaarbalans van Nederland (2011); De Ingenieur, April 2014.
Of the stated total amount 546 PJ of ‘work’, 422 PJ as electricity (CBS).
9.7388 PJ is transit only of fuel. We process 9415 PJ, for export plus 783 PJ as fuel for international transport
-
10.Technologiekrant, 2010 09 24. KEMA also states that export of wind energy oversupply will hardly
be possible, because of increased wind capacity elsewhere.
11. C. Ummels Ph. D. Thesis TU Delft Februari 2009.
12. F. Udo Curtailment in the Irish power system
http://www.clepair.net/Udo-curtail201205.html
-
13.It is irrational to trottle back CO2 free generation at the Borssele nuclear reactor in favour of wind energy.
Note, that this is the policy of the left in France.
14. F. Gutiérrez-Martín, R.A. Da Silva-Álvarez, P. Montoro-Pintado: Effects of wind intermittency on reduction of CO2 emissions. The case of the Spanish power system. http://dx.doi.org/10.1016/j.energy.2013.01.057
15.F. Udo, Wind energy in the Irish power system. http://www.clepair.net/IerlandUdo.html
16.J.B. Wheatley Quantifying CO2 savings from wind power; Energy Policy, 2013, . 63, issue C, pages 89-96. http://econpapers.repec.org/article/eeeenepol/v_3a63_3ay_3a2013_3ai_3ac_3ap_3a89-96.htm
17. Power and Unintended Consequences in the Colorado Energy Market.
http://www.bentekenergy.com/windcoalandgasstudy.aspx
18.The calculation can be found in note 13 of C. le Pair and K de Groot: The influence of wind electricity on fossil fuel use (De invloed van elektriciteit uit wind op het fossiel brandstofgebruik.) http://www.clepair.net/windrendement.html
19. F. Udo: Building wind turbines costs more energy than you think
http://www.clepair.net/Udo201303payback.html
-
20.Lenzen, M. (2008) Life cycle energy and greenhouse gas emissions of nuclear energy: A review.
Energy Conversion and Management 49, 2178-2199. http://www.isa.org.usyd.edu.au/
21. I. Staffell, R.Green How does windfarm performance decline with age?
Renewable energy 66 (2014) 775 www.elsevier.com/locate/renene
-
22.R.P. vd Pieterman et al Optimisation of maintenance strategies for offshore wind farms.
http://www.ecn.nl/docs/library/report/2011/