
Wind energy and CO2 emissions in Ireland.
Fred Udo
October 21 2011
Introduction.
The purpose of adding wind energy to an electric grid is to reduce the fuel consumption of the fossil based generators of the system. Wind energy proponents repeat incessantly, that adding x% of wind energy reduces x% fuel or CO2 emission.
In many countries this unsubstantiated statement cannot be verified, because real-time grid operation data is withheld from the public.
Recently Eirgrid, the Irish grid operator, began to publish real time data about the performance of the Irish electricity grid. The website: www.eirgrid.com shows the values of the total demand, the production of wind and the CO2 emission for each quarter of an hour.
This data enabled a study of the impact of wind energy on the Irish electric grid.
The first results are posted on: www.clepair.net/IerlandUdo-e.html
This article contains a second analysis of the relation between CO2 emission and the contribution of wind energy using the real time operations data from Eirgrid.
The conclusion is, that the reduction of fossil fuel consumption is bound within tight limits.
Definitions.
In discussions about this subject wind penetration is defined as the contribution of wind energy to the total electricity production in a year.
As the Irish data are available for each quarter of an hour, this period of sampling time can be chosen much shorter. In that case one has to distinguish between wind contribution and wind penetration.
The two numbers are only equivalent if the integration is done over a time span, which allows the (Weibull) distribution of wind velocities to be represented in the data. .
(The numbers are not equivalent, if we evaluate the wind contribution on a windy day).
The efficiency of adding wind to an electric grid is defined as the reduction of CO2 intensity divided by the contribution of wind to the system. Promotors of wind energy put this efficiency invariably at 100%.
The CO2 intensity is the amount of CO2 emitted for the production of one kWh of electricity.
This quantity can be defined as the emission of the fossile fired plants only or as the emission of the system including wind. Both quantities will be used here.
The Irish system
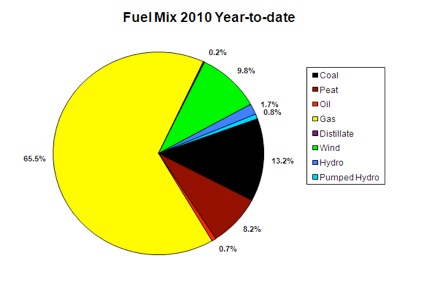
The fuel mix of the Irish grid is illustrated in figure 1
The original can be found in:
http://www.eirgrid.com/renewables/
The share of gas (66%) and solid fuel (21%) is about the same as in the Dutch system.
The wind penetration was 9,8% in 2010.
The study is hampered by the fact that the contribution of hydro energy is not specified in the Eirgrid data, although the Irish system has of 216 MW of hydropower and one 280 MW pumped storage hydro plant. Hydro energy can be quickly ramped up and down and is therefore the ideal backup for accommodating the variable wind energy to the grid.
The installed capacity mix is: 6,750 MW fossil, 1,500 MW wind, 250 MW hydro
The 7 GW of traditional capacity is only very partly used, as the average demand is normally between 3 and 4 GW.
Notes:
- The “9.8% wind” is energy, not installed capacity.
- During periods of low rainfall, hydro energy is minimal.
It appears, that the drought in the first half of the year 2011 has adversely affected the use of hydropower in the months April to June 2011. This enables us to study the CO2 emissions in absence of hydropower.
The pumped hydropower station is during 2011 affected by a renovation of the installations.
The CO2 emission calculation.
The following is a direct quote from the site of EirGrid:
“EirGrid, with the support of the Sustainable Energy Authority of Ireland, has developed together the following methodology for calculating CO2 Emissions.
The rate of carbon emissions is calculated in real time by using the generators MW output, the individual heat rate curves for each power station and the calorific values for each type of fuel used. The heat rate curves are used to determine the efficiency at which a generator burns fuel at any given time. The fuel calorific values are then used to calculate the rate of carbon emissions for the fuel being burned by the generator. “
Note 1:
The heat rate degradation due to ramping down the fossil-fired plants with wind energy surges and ramping up with wind energy ebbings is not accounted for in the calculations of EirGrid.
This means the CO2 emissions posted on the site are understated.
Note 2:
The total CO2 emissions are presented in tons. The specific emissions of fossil burning are called the CO2 intensity. The CO2 intensity is expressed in g/kWh.
April 2011.
During the month of April 2011 the contribution from hydro was small due to minimal rainfall, while the pumped hydro facility was undergoing a renovation. In April we see the response of a system with 21% coal and peat and 66% gas subjected to 12% wind energy.
The CO2 emission is best expressed as CO2 intensity. This is the CO2emission in grams per kilowatthour produced by the conventional fossil fuel fired power stations on the grid.
The CO2 intensity can also be calculated as the CO2 emission divided by the total electricity production.
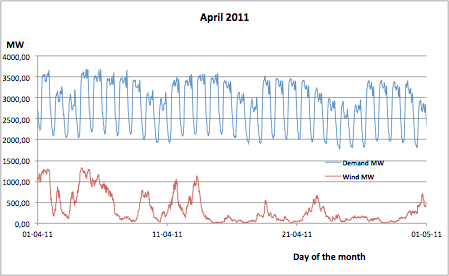
Figure 2 Total demand and total windproduction
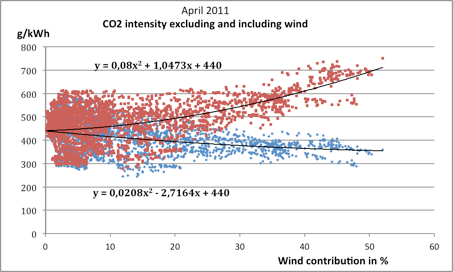
The exhibit shows the correlation of both CO2 intensities as a function of the contribution of wind to the system.
Figure 3:
CO2 intensity with and without wind
The red data points represent the CO2 intensities from conventional generators. The blue points represent the CO2 intensities calculated for the production including the wind contribution.
A quadratic fit curve has been fitted to each of the two data-sets. These fits have been adjusted so that they cross the zero wind contribution line with the same value of CO2 intensity.
This fixes the CO2 intensity at zero wind at 440 g/kWh. This result is slightly different from the number given in the original article (436 g/kWh), because we now use two quadratic fits instead of one linear fit. The average of the blue points gives the overall CO2 intensity as 418 g/kWh, so the CO2 reduction is 22/440 = 5,0%.
The wind penetration was 12% in this month.
The red emissions increase and the blue points run more horizontal with increasing wind contribution. This implies, that wind contributions above 30% have little influence on the CO2 emission. The last chapter discusses the consequences.
Please note:
The points presented in the correlation diagram are based on the emission data calculated by Eirgrid, which do not include heat degradation effects of ramping the conventional generators. This effect causes extra fuel consumption and thus increases the CO2 emission.
LePair has suggested an algorithm to account for the cycling of fuel generators. (www.clepair.net/windSchiphol-e+nl.html )
Applying an algorithm on the data as suggested by LePair increases the total CO2 emission by 5%. This is due to the daily variations of the demand together with the variations of wind.
The CO2 reduction due to the 12% windpenetration decreases from 5,0 to 4,0% as a result of this increase due to cycling.
This implies, that the measured CO2 reduction is 4,0/12 = 33% of the value quoted by wind energy promotors. Please also note that this holds for 12% wind penetration in a system that has still a small component of hydro energy.
The period from nov. 2010 to aug. 2011.
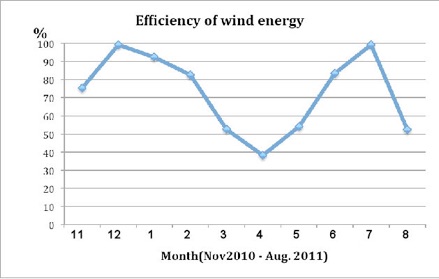
Figure 4 shows the performance in the period from Nov 2010 to August 2011.
The data was obtained by applying the same analysis to the data of all the other months available.
The response of the Irish system over the period Nov 2010 to August 2011 to a wind penetration of 10% is an overall reduction of CO2 intensity with 7%. This reduction decreases to 5,6%, if an algorithm based on the effect of cycling is taken into account. The efficiency of wind is 56% in the Irish system at 10% wind penetration.
The conclusion drawn from the April data is, that a system with 21% coal and 65% gas and a small amount of hydropower will show a CO2 intensity reduction of about 4% for absorbing 10% wind energy; i.e. a 40% efficiency of wind energy.
Curtailment.
The correlation diagram shows, that a wind energy penetration of 12% implies a variation of wind contributions between zero and 50% of the total demand. The distribution of the points makes, that the bottom curve is flattening out. The conclusion is, that percentages of wind above 30% cause little or no reduction in CO2 emission due to decreased fuel efficiency of the backup stations.
The fit to the blue points shows the overall CO2 intensity to drop from 377 g/kWh to 356 g/kWh, if the windcontribution increases from 30% to 50%.
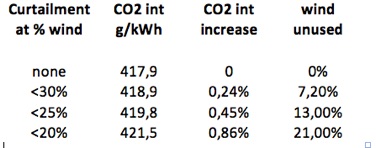
The average CO2 intensity (all the blue points) is 417,9 g/kWh.
Curtailment at 30% wind is applied by attributing all points above 30% the fitted value at 30% wind contribution. (377 g/kWh)
The average CO2 intensity increases from 417,9 g/kWh to 418,9 g/kWh in this case.
This is an increase of 0,24%. The curtailment causes 7,2% of the wind energy to be lost .
The wind contribution lowers from 12% to 12%*(1 - 0,072) = 11%.
Variation of the upper limit for the wind contribution gives the following results:
The first conclusion is, that curtailment at twice the penetration value is a perfectly sensible operation. It significantly reduces maintenance in the conventional stations and reduces the extra fuel consumption due to the deep up and down ramping to accommodate the excess wind energy to the grid.
The second conclusion is, that increasing the penetration of wind energy beyond 10% will have a negligible effect on the fuel consumption of the total system.
These conclusions hold only for a system without energy storage.
The curtailment limit of 25% is not a fixed limit as it is related to the instantaneous demand. This demand has the usual day – night fluctuation, so the system can accommodate more wind energy during the day.