
A Narrative about Wind in the Irish Grid.
Talk given for the Suir Valley Environmental Group
Fred Udo
Jan 20 2016

Abstract
This talk is inspired b
This talk is inspired by the current political ambitions in Ireland and in the Netherlands to install 6 GW wind energy.
The first part of the talk discusses the nature of wind energy.
The second part presents the effect of imposing wind energy on the fossil fuel part of the Irish grid. The data are provided by a report of the Sustainable Energy Authority of Ireland (SEAI). The report tells us, that the fuel saving due to wind is 79% of the nominal fuel saving. This is the first time a government body admits, that insertion losses are considerable. A close analysis based on the SEAI data shows that the fuel saving in reality is only 40%. Including the self-energy of the wind turbines decreases the fuel saving to 35% of the nominal fuel saving. This result does not include curtailment of wind energy.
The third part discusses the Irish ambitions to provide 40% of its electricity by wind energy. Curtailment losses turn out to be prohibitive to increase the wind contribution in the existing grid above around 30%.
y the current political ambitions in Ireland and in the Netherlands to install 6 GW wind energy. ing to 35% of the nominal fuel saving. This result doe
Contents.
1. Introduction
– General situation
2. What is wind energy
-Amount of energy in wind.
-Capacity Factor
3.It blows somewhere
-Excess production
4.The generating capacity present
5.The fuel/CO2 saving
5a. Statistics
5b. 15’ data
5c. the SEAI report
6. CO2 emission calculation
7. Pay Back Time
8. The Irish ambition.
-Curtailmen
-40% Wind Contribution
1. Introduction.
This talk intends to show, that the reputation of wind energy as a clean CO2 free energy source is not based on facts.
We all know that wind turbines take a lot of space.
We all know that wind turbines spoil the landscape.
We all know that wind turbines kill birds and bats.
We all know, that wind turbines need subsidy to survive.
The question to be answered is:
Is it possible to power a modern society with a technique invented in the middle ages and abandoned shortly after the invention of the steam engine?
If the answer is yes, is there a balance between the burden and the profits for our society?
The proponents argue:
“The spoiling of the landscape is a small price to pay to ensure a carbon free future for your kids. Hindrance and health effects on the population will be minimized, so how can you be against a clean solution of our future energy needs?”
The real argument is never brought in the open. The real argument behind the drive for a wind energy project is money, provided by lavish subsidies. This is a problem for every action against the blotting of the landscape with yet another couple of wind turbines, as money nearly always wins.
The ambitions over our respective governments to erect wind turbines all over the country are surprisingly similar:
IrelandNetherlands
6 GW on 70 000 km26 GW on 30 000 km2
5 million people 16 million people
You see, that the Dutch are relatively much harder hit than the Irish people.
In Holland we have 140 action groups like the Suir Valley Environmental Group here. The government has recently taken action to break the power of these groups by denying legal backing to their objections. In Holland democracy has given way to wind.
2. What is wind energy?
2a. The energy content of wind.
The energy content of wind is proportional to the 3rd power of the wind velocity or in other words:
Twice the wind speed generates 8 times more energy. This amplifies the fluctuations of wind energy generation compared to the natural fluctuations of the wind speed.
2b. The Betz limit.
Aerodynamics tells us, that the maximum energy that can be extracted from wind is 59% of its energy. Modern turbines reach 45%, so improvements in the efficiency of a modern wind turbine are at best marginal. There is no hope for a substantial improvement of the technique.
2c. The Capacity factor.
Wind turbines run most of the time at less than their nominal power due to fluctuations of the wind. In Ireland the capacity factor is around 0,3. This means, that a 1 MW turbine delivers in average over a year 0,3 MW or 300 kilowatts. Keep this in mind if one talks about the installation of so many megawatt turbines. They run only 0,3 x 7 = 2,1 days a week.
3. The wind always blows somewhere.
The variations in wind energy are best illustrated by the performance of a few thousand wind turbines scattered all over Germany.
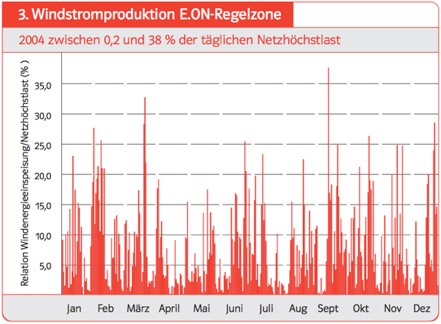
Figure 1
It is clear, that sometimes the wind blows nowhere. The variations on the production are a factor 190 from minimum to maximum.
A British group has made a study to quantify the problem.
This result shows that 10 GW wind power dispersed over all of the UK can deliver full power 17 hours every year and is incapable to produce any significant amount of power during 20 weeks per year. The capacity factor in the UK is 0,26. This is nearly the same factor as in Ireland.
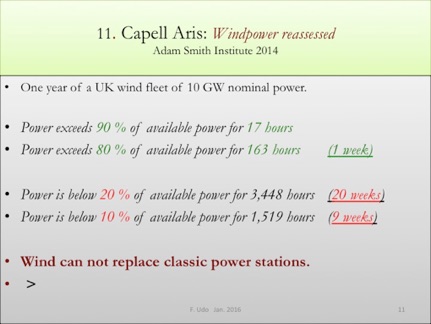
These numbers show that wind turbines cannot replace classic power stations. Wind energy means structural over capacity.
The case of Denmark illustrates this, as the large wind energy production is predominantly absorbed by the Norwegian water reservoirs.
Wind Export Denmark
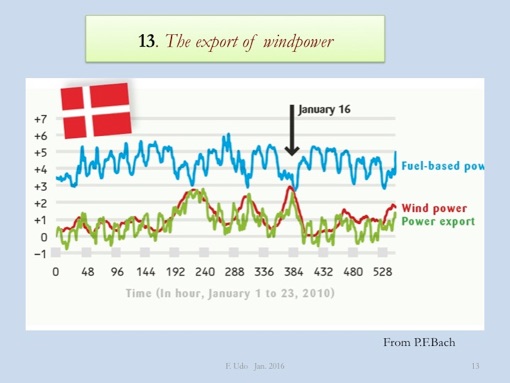
The red line of the wind power production follows the power export, which is modulated by the daily demand variation.
4. The necessity of installing extra capacity in Ireland.
Electricity is a special kind of commodity. On one hand an uninterrupted supply is essential for modern society, on the other hand storage of electricity on a scale to supplement interruptions of supply caused by a lack of wind is presently impossible except by hydropower. This is insufficiently available in Ireland and generally in Europe.
The average demand for electricity on the All Island grid is 4,5 GW with peak demand around 6 GW.
Due to operation safety one needs to have a running reserve equal to the largest unit in service that could fail. This is currently 500 MW, but wind energy is a special case. On the time scale of several hours all turbines in Ireland go up and down together. Wind fields are much larger than Ireland.
The next figure shows, that Ireland does not suffer from a lack of generating capacity.
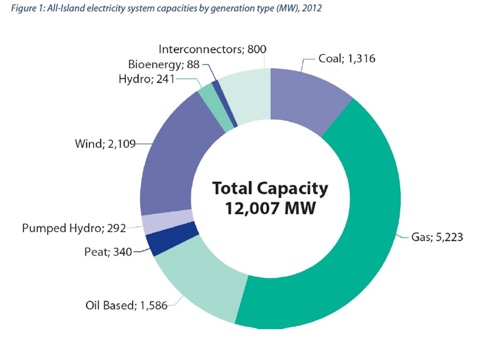
We see, that 6 GW of peak demand is served by 12 GW capacity. This will be extended to 16 GW when the 6 GW wind project is completed!
A few Gigawatt might be mothballed, but 6 GW balancing capacity will always be needed to ensure that the lights stay on if the wind fails.
In 2014 there was 38 GW of wind power and 38 GW of solar power in Germany. The average demand for electricity in Germany is 72 GW, so the wind and solar capacity exceeded demand. We know, that installing a Giga-watt of wind or solar does not deliver a Giga-watt of power all year, but the result is nevertheless surprising:
Only 14,8% of the German electricity production is delivered by wind and solar energy.
This amounts to 2,8% of the total energy consumption in Germany.
The consumption of fuel for heating, transport and industry are unaffected by windmills.
5. The fuel/CO2 saving by wind energy.
The Brussels doctrine
The doctrine preached by the Brussels authorities is that x% wind in the system replaces x% fuel consumption or in other words: 1% wind avoids 1% CO2 emissions of fossil fuel powered electricity.
This we shall call the “Nominal CO2 Saving”.
Three methods have been used to study the fuel saving by comparing the performance of a grid with- and without wind.
a.Statistical data
b.Time resolved data
c.Detailed grid analysis
5a. The yearly published energy statistics.
As the contribution of wind energy in many countries is now higher than 10% of the total electricity supply one can expect to see the effect of the new energy source in the statistics of fuel consumption.
The problem here is, that not only wind energy has been introduced in the last 10 years, but that also the fuel mix used in the classical power stations has been altered.
Coal has been substituted by gas and wind power has been introduced in the current of the last 25 years.
In Denmark the Danish Energy Agency has published a graph that illustrates both effects.
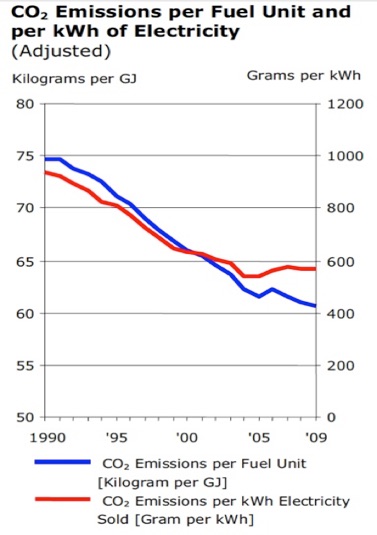
The replacement of coal by gas starts in 1991 It is is clearly visible in the slope of the blue line which represents the carbon content of the fuel mix used.
The effect is shown by the slope of the red line, which indicates the decreasing amount of CO2 emissions per kWh generated. The introduction of large-scale wind energy since 1998 has the opposite effect on the red line as the emissions hardly fall while the CO2 content of the fuel continue to fall.
The contribution of wind energy to the electricity market was 20% in 2009
Wind energy increases CO2 emissions in Denmark.
5b. Time resolved data.
The exhibit about wind energy in Germany shows, that in a system with wind there are times that wind is absent. The CO2 emissions can be correlated with the different amounts of wind in the system, if time resolved data of fuel use could be obtained.
These data are not available in the public domain. Next best is the use of time resolved calculated CO2 emission data. Eirgrid did publish such data and they were used in reference B.
The next graph taken from ref B shows the correlation between different amounts of wind and CO2 emissions or fuel use in the fossil system in April 2011. The horizontal scale is the contribution of wind energy in per cent of the total consumption.
Conclusion:
The fossil fuel stations emit more CO2/kWh when wind is present.
“ Correlation is not causation, but it gives a damn good hint.”
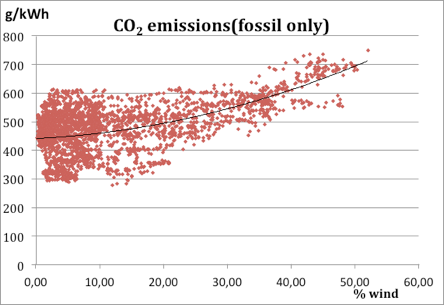
The efficiency of wind to decrease CO2 emissions was calculated to be less than 40% compared to the Nominal Saving. This number is based on the CO2 emissions calculation of Eirgrid. This calculation has some serious deficiencies, which are discussed in section 5.
Note.
Eirgrid published the 15’ data in the period 2010 to 2014. The data are not anymore available on the Eirgrid website.
5c. Grid operation analysis with and without wind.
The fuel saving due to wind power in the Irish electricity grid has been investigated by the Sustainable Energy Authority of Ireland (SEAI) for the year 2012.
The title of the report is:
Quantifying Ireland’s Fuel-and CO2-Emissions Savings from Renewable Electricity in 2012
The report analyses the influence of 15,2% wind contribution on the performance of the fossil fuel generators in the All Island area. It is readily available on the website of the SEAI.()
The SEAI 2012 report describes the performance of the complete All-Island grid in 2012. It then compares the performance of the grid with a scenario in which the wind contribution is removed. This work was done with the help of the Plexos program. This is a program used by many electricity companies around the world to analyse the performance of distribution grids.
The main SEAI result is quoted on page 29 of the report:
“Figure 15 shows, that the levels of wind on the system in 2012 had the effect of reducing the total electricity system emissions intensity by 12% relative to a case where all wind generation was removed.”
The contribution of wind was 15,2% according to the SEAI definition, so the efficiency for saving fuel is the ratio of these two numbers. This results in 12% / 15,2% = 0,79 of the Nominal CO2 Saving.
Here the report writes history, as this is the first time a government body admits, that the “Nominal CO2 Saving” is not attained in practice.
The SEAI numbers are closely examined in an analysis available in full in reference A
Note
In Januari 2016 the links to the report disappeared from the SEAI website.
It can now only be accessed via the search facility of the site with the keyword: “Quantify”
Here the principles of the analysis and its main results are reported.
The wind contribution is stated to be 15,2% of the All Island’s total consumption of electricity, but there was a contribution of imported current, which is not part of the generation on the Island. Subtracting the imports brings the amount of wind to 16,2% of the total amount of electricity generated on the island.
The SEAI reference scenario should be the All Island system without wind, but the report introduces a few significant changes. The wind contribution is replaced not by the increased use of the same generators, but a significant amount of Open Cycle Gas Turbines (OCGT) has been added. These generators are very inefficient and emit a lot of CO2 per kWh generated.
By reducing the OCGT contribution to the amount used in reality (the case with wind) the reference case produces less CO2 than the reference case used in the report. The CO2 emission saving between the systems with- and without wind reduces from 12% quoted in the report to 8,5%.
Both numbers from the report have now been corrected, so the corrected saving becomes:
8,5% / 16,2% = 0,52 of the Nominal Saving.
The two corrections of the report bring the saving of 16% wind in the Irish grid down to half the Nominal Saving.
6. The CO2 emission calculation
The analysis presented above relies on the CO2 emission calculation developed by Eirgrid, the Irish grid operator. This calculation neglects the increased fuel consumption due to ramping of the generators. This ramping is necessary to accommodate both the daily variation of the demand and the fluctuations in the amount of wind energy produced. It is the so called load following of the power stations.
The definition taken from the website of Eirgrid is:
“The rate of carbon emissions is calculated in real time by using the generators MW output, the individual heat rate curves for each power station and the calorific values for each type of fuel used.”
This defines the CO2 emissions as the emissions of a generator in a steady state, thus the extra fuel consumption due to ramping is not included. The effect of ramping on the CO2 emissions can be seen by comparing CO2 emissions calculated from fuel inputs with the calculated ones published every 15 minutes on the Eigrid website. The 15 minutes CO2 data are averaged over intervals of a year and plotted as the red dots in the following graph. The blue line is calculated from the fuel input data corrected for imports.
Note.
The 15’ data can now only be downloaded day by day from the Eirgrid website, so new data is very difficult to download.
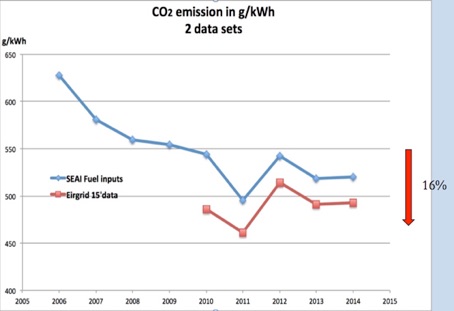
The exhibit shows the two sets of data for the years 2011 to 2014.
The difference between the two curves is 7%, so this is the effect of load following/ ramping of the variations in the demand due to daily variations of demand together with variations in the production of wind power.
The dip in the curves in 2011 is due to the contribution of two modern Combined Cycle Gas Turbines, which were installed in 2010. Later they were hardly used because the price of coal dropped.
The red arrow indicates the “Nominal Saving” due to 16,2% of wind.
The effect of 16% wind is simply not visible in contrast with the dip caused by using CCGT’s in 2011.
The majority of the ramping is due to the daily variation of the demand. The SEAI report states that presence of wind energy in the system increases the daily load following by 30%. The total extra fuel use due to ramping was determined from the preceding graph to be 7%. This implies, that wind increases CO2 emissions due to load following by 1,8% above the CO2 emission calculated by Eirgrid. These 1,8% count in full in the comparison between the system with- or without wind, because the daily fluctuations of the demand are equal in the two cases. The conclusion is, that ramping of the fossil fuel generators due to wind decreases the CO2 emission saving from 8,5% to 6,7%.
The division of the two numbers becomes:
6,7% / 16,2% = 0,41.
The efficiency for replacing fossil fuel by wind energy is 41% in the All Island system.
7. The Pay Back time or Energy Return on Energy Invested
This result presented above is based purely on the operational performance, but building a parasitic generating system costs not only money but also energy. This has to be included in the final account of wind energy.
The Energy Return on Energy Invested (ERoEI) is a parameter describing the amount of energy needed to produce a certain amount of energy. It is used generally to characterise an energy source.
Wind energy does not require fuel during production, so one has to compare the energy invested in the construction of wind turbines with the energy produced during their lifetime. The pay back time is the time necessary to produce the construction energy of wind turbines. There is extensive literature about this and one can distinguish between articles written by the proponents of the wind industry and articles written by people with less financial interest in this activity.
The wind lobby usually neglects secondary investments done in infrastructure (roads, HV lines) and quotes the pay back time as 3 to 6 months. Of late this time span sometimes extends to 9 months.
The head of the R&D section of a Dutch building firm did a calculation on our request and the result was 18 months for a capacity factor of 0,22. A large survey done by the university of Sydney came to 11,5 months for turbines with a capacity factor of 0,25.
It seems not unreasonable to put the pay back time for a turbine in Ireland on one year.
This pay back time ignores the quality of wind energy. The preceding chapters show that wind electricity replaces only 41% of the Nominal Saving. This implies, that the pay back time of wind turbines is not one year, but 2,5 years.
The lifetime of a turbine is about 20 years, but wear and tear diminish the production by 1,6% per year. This reduces the effective life span to 17 years full production. Comparing the corrected pay back time of 2,5 years with the effective life span of 17 years, we conclude, that the ERoEI is 17/ 2,5 = 7.
This means, that 15% of the production of the turbine is for its own use.
The 6,7% nominal saving obtained in 2012 reduces to 0,85 x 6,7% = 5,7%
The efficiency of fuel saving due to 16,2% wind in the Irish grid is 5,7 / 16,2 = 35%.
This dismal performance is due to 16% wind only.
With higher wind penetration the efficiency will be less than 35%.
Earlier work (B,C) arrives at roughly the same conclusion.
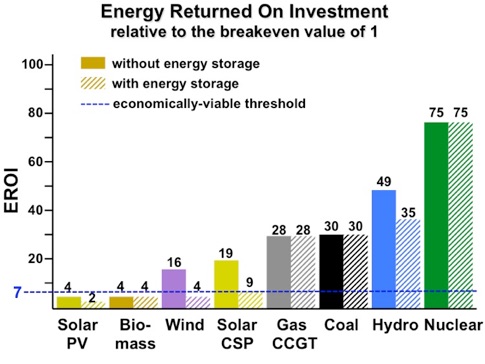
A survey of different sources of electrical energy. An energy source can only support modern society if its EROI exceeds the value 7.
Part 8. The Irish ambition: 40% from wind
The average demand in the All Island grid is about 5 GW, thus the Irish ambition to generate 40% of the electricity produced from wind requires 2 GW wind energy generated in average over one year.
The capacity factor of the turbines is 0,3 so one has to install (2 GW) / 0,3 = 6,7 GW wind capacity. It is noted, that this capacity is higher than the peak demand in the grid. This notwithstanding the fact, that there are obstacles to wind energy reaching 100% of the demand. This amount cannot be absorbed in the grid, because big rotating generators are essential to stabilise the grid. This limits the maximum wind contribution to 50% of the momentary demand. The grid operators are trying to lower this to 40%, but 100% is impossible due to this factor alone.
The next problem is the primary reserve necessary to cut in as the wind weakens. From the 15 min data of Eirgrid can be deduced a margin of 1,2 GW between demand and wind production. Part of the wind turbines has to stop operating if the wind production exceeds the amount that can be absorbed in the grid. This is called curtailment of wind energy.
The curtailment is measured using the 15’ Eirgrid data and it can be extrapolated to higher wind contributions by multiplying the wind production measured in 15’ intervals by two, three or more and comparing the increased wind production with the demand every 15 minutes. The next graph is obtained in this way.
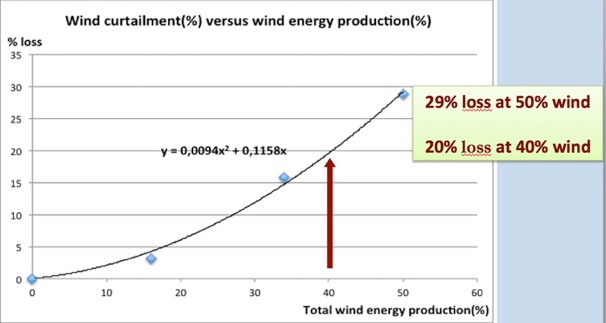
These data can be used to estimate what will happen when the contribution of wind increases.
The graph tells us, that
InstalledGeneratedLoss Delivered
5,0 GW1,5 GW-12% 1,30 GW
6,7 GW 2,0 GW -20% 1,60 GW
8,5 GW 2,55 GW-29% 1,78 GW
10,0 GW3,0 GW -40% 1,80 GW
Clearly the ambition of 40% wind cannot be realised in the present grid.
The EW connector might lessen the burden until the British have also installed their wind power projects. As wind fluctuations are strongly correlated between the UK and Ireland we expect that within 5 years the connectors become inoperative in compensating wind fluctuations.
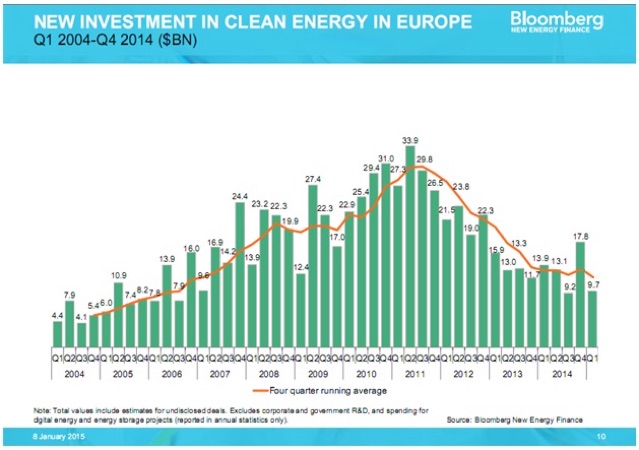
Part 9. Food for thought.
Bloomberg published a surprising graph about the investments in green energy in Europe:
References.
A. The SEAI numbers are closely examined in an analysis available in
http://fredudo.home.xs4all.nl/Zwaaipalen/17E_Wind_in_the_Irish_grid_SEAI_report_2015.html
B. F. Udo Wind energy in the Irish grid
http://www.clepair.net/IerlandUdo.html
C. C lePair, F. Udo and C. de Groot:
Wind turbines as yet unsuitable as electricity providers
Europhysics News April 2012.
http://fredudo.home.xs4all.nl/Zwaaipalen/10._Art._Europlysics_News_2012.html
Further references can be found in these three articles.