
The authors submitted this report to the House of Commons.
It is published as
“Wind - Whitehall’s pointless profligacy” in
NEW POWER / ISSUE 45 / OCTOBER 2012
“As regular readers of New Power’s Project Monitor know, there are many, many developers looking to develop wind power plant both onshore and offshore. But if they are all built will they lead to a big cut in the UK’s carbon emissions? Alex Henney and Fred Udo think not.”
DOES WIND SIGNIFICANTLY REDUCE CO2 EMISSIONS IN A THERMAL SYSTEM
OR DOES THE LAW OF UNINTENDED CONSEQUENCES PLAY IN?
June 6 2012
Alex Henney and Fred Udo
“When the facts change, I change my mind. What do you do sir?”
J.M. Keynes
SUMMARY
1. The government assumes that windmills are efficient in reducing CO2 emissions, and proposes that we spend billions on increasing wind energy capacity from 6.6GW at April 2010 to about 25GW by 2020.
2. The Danish experience with a high level of wind production provides an example of the law of unintended consequences. In winter the Danish system cannot absorb much electricity produced from wind because nearly all other power plants are combined heat and power systems and they have to run to satisfy the heat demand. In consequence the average level of CO2 emissions of electricity consumed in Denmark has not reduced much over the last decade and about a third to one half of the wind production is exported to Norway and Sweden often at a low price and reimported at a higher price in the summer. Danish customers are subsidizing Norwegian and Swedish customers, which was not part of the plan!
3. Eirgird, the Irish system operator, publishes an estimate of the CO2 emissions from the system operator every 15 minutes. In April 2011 the contribution of wind in the production of electricity was 12% in the Irish system but this wind production saved only 4% CO2 emissions. The reason is that with low hydro the system is regulated by thermal plants. Cycling and running at partial load reduces their thermal efficiency and increases CO2 emissions. Furthemore wind energy production has to be curtailed when the wind is high but demand is low. Currently about 3% is curtailed, but if the Irish government were to achieve its target of tripling wind capacity then 30% of the wind energy produced would be spilled, i.e. wasted.
4. A US study of the Colorado Public Service Company system and of the ERCOT system in Texas, which are both thermal systems with very little hydro, found similar results with thermal plant cycling reducing efficiency as shown by the performance of the Cherokee Unit 4 coal plant, and increasing CO2emissions
-
5.The system in Britain is predominantly coal and gas with some nuclear and very little hydro. A comparison with the Irish situation shows that the British system is even less suited to absorb wind energy than the Irish system.
-
6.The cost of offshore wind is about three times and onshore wind twice the current power price. The implication of these costs and the apparent ineffectiveness of windmills in mitigating CO2 emissions is that the cost/ton of CO2 saved could be truly extraordinary.
-
7.We strongly recommend that before spending £ tens of billions more on windmills, DECC should commission a scientific study of how efficient windmills are at mitigating CO2 emissions.
INTRODUCTION
8. Section 3 of the draft Energy Bill 2012 states “Electricity Market Reform will secure the investment needed to deliver a reliable diverse low carbon technology mix” (para 30), and “It is our intention that CfDs are available to low carbon generators from 2014.” (para 59). The intent is clear, and the government takes for granted that windmills are such low carbon generators. Empirical evidence suggests however that in a thermal system the deployment of a significant level of wind as proposed by the government may not significantly reduce the level of CO2 emissions.
Chapter 1
9. We start with a brief analysis of the operation of the system in Denmark, which is held up as an exemplar of producing a high level of wind to reduce CO2 emissions. We next look at the system in Ireland for which CO2 emissions are calculated every 15 minutes. We then refer to the study of emissions in Colorado and in Texas. Finally we consider the implications for policy in Britain.
DANISH UNINTENDED CONSEQUENCES
10. In 2011 Denmark produced 33.3TWh of which 9.8TWh (29%) was wind from 3100MW of capacity. This capacity has hardly changed since 2004. In 2011 Denmark imported 4.5TWh and exported 3.2TWh; most of the trading is with Scandinavia. The Danish system is effectively regulated by hydro in Norway and Sweden to follow the variability of wind production. Data from www.energinet.dk (environmental report) shows that although the CO2 emissions per fuel unit used has continually declined since 1990, the emissions per kWh sold in Denmark have more or less leveled since 2003, see exhibit 1.
Exhibit 1: CO2 emissions per fuel unit and per kWh of electricity)
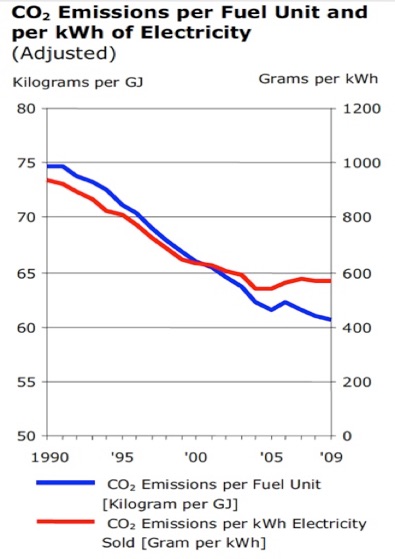
11.The reduction from 1990 to 2000 was mainly due to the conversion of power stations to CHP units and the introduction of gas in the fuel mix. The CO2 content in the electricity produced shows a leveling off from 1998 onwards. This is the year large scale wind energy was introduced in the system. The unintended consequence is, that during winter the electricity production is dictated by the demand for heat, so the system cannot accommodate the fluctuating contribution of wind, see exhibit 2.(1)
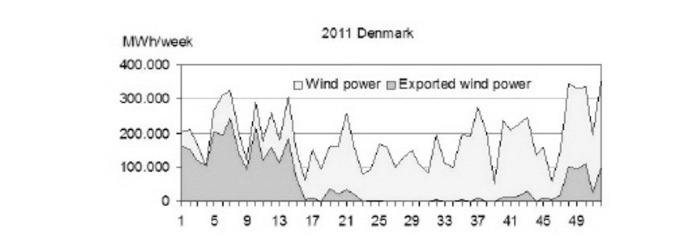
12. The share of exported wind energy is high during the cold seasons when increased demand for heat entails high electricity production from the CHP plants. The export of wind energy was 3.0TWh in 2011 or 31% of the wind energy production. Consequently, Danish customers pay part of their windmill subsidies twice over, once to produce the power and ship it to Norway for lower or even negative prices, and again to reimport it often at higher prices. (Effectively Danish customers are subsidizing Norwegian and Swedish customers). Neither of these factors are what the Danish government intended, when starting the build up of wind power. (refs 2,3)
2. IRELAND
13. In 2010 gas produced 66% of Irish electricity; coal 13%; peat 8%; wind 10%; hydro and pumped hydro 2.5%; other 1%. Most of the regulation to respond to variations in wind and output is usually provided by CCGTs and OCGT’s and 3 hydro facilities totaling about 180MW. A pumped storage facility of 270 MW was being rebuilt during 2011.
14. Eirgrid, the system operator, calculates the emissions of CO2 from the system as a whole using “static” heat rates for thermal plants (i.e. assuming they operate at a constant output). This approach overstates their efficiency and understates their CO2 emissions because when gas plant ramp-up and –down (i.e. “cycle”) their thermal efficiency reduces – hence their CO2 emissions/MWh increase. The estimated average emissions using static heat rates for the period November 2010 to August 2011 was 451g/kWh while the average CO2 emissions calculated from the carbon input from gas and coal was 528/kWh, which is 17% higher. Part or all of this difference can be attributed to the static approach used in the CO2 calculation of Eirgrid. The CO2 savings for the period November 2010 to August 2011 were analysed and the “efficiency” of wind in reducing CO2 emissions is defined as (4):-
The ratio of the measured reduction in CO2 emissions, to the reduction in CO2 emissions calculated as if every MWh of wind energy produced replaces a MWh of conventional electricity production without change in efficiency of the conventional plants.
The efficiency varies month by month, see exhibit 3.
Exhibit 3 The efficiency of wind in reducing CO2 in Ireland

15. Why the difference from month to month? In particular what happened in April 2011? The answer might be the availability of hydro, see exhibit 4.
Exhibit 4 The influence of hydro power on CO2 saving efficiency
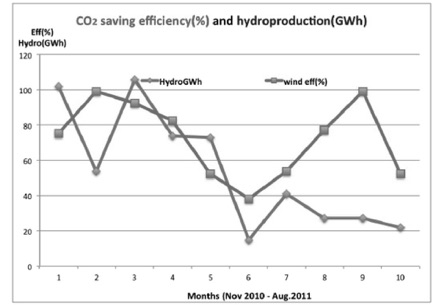
In 2011 the pumped storage facility at Turlough Hill was being renovated; in consequence gas plants had to cycle more and thus produced more CO2. The result was that a 12% wind contribution saved only 4% CO2 emissions.
16 .As is well known the wind blows when the wind blows, and it is not correlated with electricity demand. This is a significant feature of wind, which is implicit in the Danish situation of shipping wind to Norway and Sweden because the Danish system cannot absorb the wind. This situation occurs in every power grid as generators cannot be shut down at will. In the absence of export possibilities, such wind will have to be curtailed. In practice this situation will occur simultaneously all over Western Europe as the wind forces are highly correlated. This implies that in 2020 export will play a minor role in solving this problem, as all countries are erecting windmills by the thousands. The phenomenon of a large production of wind energy has led Nordpool, the Nordic electricity exchange, to lower the floor price from zero to minus 200 euro/MWh.
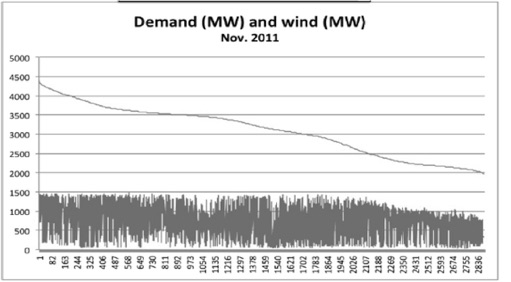
17. In reference 4 the amount of must run capacity in the Irish system of 1300MW is derived from the data. Thus when the demand is low and the wind potential is high, wind energy has to be spilled. This is demonstrated with the aid of a load duration curve is constructed from all the daily load curves put together with the points sorted in order of decreasing demand. (For a complete explanation see the appendix of reference 5). Exhibit 5 shows the load duration curve for November 2010 with the associated level of wind; once demand reduces below about 2500MW the wind is increasingly curtailed – In this case about 3% is lost.
18. The Irish government has a target of three times the current level of wind by 2020, which would result in spilling 30% of the wind energy production, see exhibit 6.
Exhibit 6 If the government target for wind in 2020 were met, 30% of the wind energy would have to be spilled
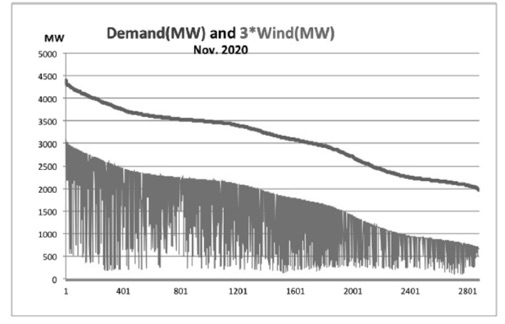
The upper limit of the wind contribution follows the demand curve, in such a way, that the must run capacity of 1300 MW can always run. The non-curtailed wind is the same as in exhibit 5, but three times higher. Its upper limit runs now at 4200 MW. It follows, that curtailment now can occur at all times during the day.
3. COLORADO AND ERCOT
19. Energy Consultant Bentek undertook a study of the effect of wind on emissions of SOx, NOx and CO2 for two systems:-
•The system of Colorado Public Service Company (PSCO), with in 2008 3.8GW of coal plant, 3.2GW of gas plant, 0.4GW of hydro and pump storage, and 1.1GW of wind, and
•The ERCOT system in Texas, which is a virtually stand alone system that manages about 85% of the capacity in Texas. In 2009 it had 17.5GW of coal plant, with 44.4GW of gas plant, 5.1GW of nuclear, 0.6GW of hydro, and 9.4GW of wind; the system produced 300TWh and met a maximum demand of 63GW. Wind provides between 5% and 8% of the average generation overall, depending on the season, but at night its contribution rises slightly from 6% (summer) to 10% (spring)
Both systems are predominantly thermal with significant wind relative to their size, and little hydro.(ref 7)
20. The studies used publicly available hourly data for boiler specific emissions and production which are provided to the Continuous Emissions Monitoring System of the Environmental Protection Agency and data provided to the Federal Energy Regulatory Commission. ERCOT also publishes wind, coal, nuclear, natural gas and hydro generation data on a 15-minute basis. The PSCO part of the report first examines in detail the impact of cycling for CO2 coal plants over a number of days when there are “wind events”. The avoided generation from coal plants was calculated; the monthly and quarterly “stable day” emission rate was calculated; finally the difference between the actual emissions and the emissions that would have been generated if the avoided generation had been produced with the “stable day” emission rates was calculated.
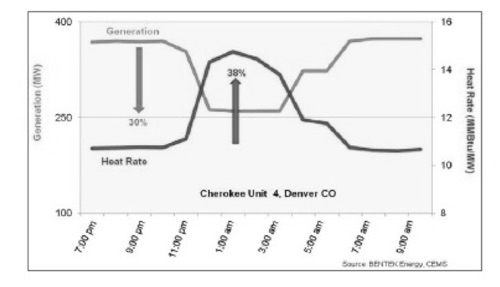
21. The effect of cycling coal plant is shown by the operation of Cherokee Unit 4 located in Denver. Between 7:00 pm and 9:00 am on March 17 and 18, 2008, see exhibit 7. “Total generation from the plant is shown in blue; the heat rate – defined as the MMBtu of fuel per unit of generation – is shown in red. Between 9:00 pm and 1:00 am, generation from the Cherokee 4 fell from 370 to 260 MW. It then increased to 373 MW by 4:00 am. During the period in which generation fell by 30%, heat rate rose by 38%. Heat rates are directly linked to cycling: as the generation from coal plants falls, the heat rate begins to climb. Initially, the heat rate climbs because generation of the plant is choked back and fewer MW are produced by the same amount of coal. Later in the cycle, the heat rate climbs further because more coal is burned in order to bring the combustion temperature back up to the designed, steady-state rate. Additionally, for many hours after cycling, the heat rate is slightly higher than it was at the same generation level before cycling the plant.”
Exhibit 7 Impact of generation decline on heat rate
22. In addition to the micro study of wind events on particular plants, the study also looked at the coal cycling impacts on PSCO’s territory emissions. The conclusion of the study was that:-
“…cycling of coal-fired facilities has increased significantly since 2007 as wind energy generation increased to its current levels…the increased incidence of cycling has lead to emission of greater volumes of SO2, NOx and CO2. In 2008, depending on the method of calculation, cycling coal plants caused between 1.1 and 10.5 million pounds of SO2 to be produced that would not have been produced had the plants not been cycled…Cycling’s impact on CO2 is more ambiguous as the range is between creating a saving of 164,000 tons and a penalty of 151,000 tons. In 2009, generation from PSCO’s coal-fired plants fell off by about 20%, but their emissions did not diminish proportionately.
Again, cycling appears to be a central factor…between 94,000 and 147,000 pounds of CO2 [was produced] more than would have been generated had the plants been run stably.”
23. The conclusion of the study of ERCOT, which was undertaken in a similar manner to their PSCO analysis, is:-
“Not only does wind generation not allow ERCOT utilities to save SO2, NOx and CO2 emissions, it is directly responsible for creating more SO2 and NOx emissions and CO2 emission savings are minimal at best.”
4. BRITAIN
24. The system in Britain is predominantly coal and gas with some nuclear and very little hydro, proportionally less than in Ireland. The wind capacity at April 2012 was 6.6GW. National Grid’s Gone Green Scenario, which is consistent with the ambitions of the government, is for about 25GW of wind. The system currently needs about 4GW of regulating capacity available at all times, of which about 1.8GW is provided by pumped storage and the balance by part-loaded CCGT and coal plants. Most, if not all, of the additional 18GW required under the Gone Green scenario for 2020 is likely to be thermal plant. A comparison with the Irish case result in 20% of the wind energy will be spilled and the fuel saving of the remainder will be merely between a third and a half of the anticipated value.
25. The latest levelised cost estimates (8) for windenergy were prepared in October 2011 for the government by Ove Arup and Partners with assistance from Ernst & Young.(9) To these costs we have (after crawling through the detailed figures) added the annuitised value of a relevant share of the cost of transmission development proposed in the Electric Network Strategy Group’s recent report (10).Thus for a total of 14.4GW of offshore wind we will incur £3.8bn of transmission investment and for 6GW of onshore wind an additional £3.9bn. Annuitising the investment we get a charge of about £240m for 14.4GW offshore wind and £240m for 6GW of onshore wind. Suppose the offshore windmills generate with a load factor of 34% and onshore at 25% (which is perhaps a generous estimate given that the actual load factor of windmills in England averaged around 20% across 2010 then we get a charge of about £5/MWh for offshore and £16/MWh for onshore wind. Thus the medium scenarios for wind in 2015 are costs for offshore of £144/MWh (say £145/MWh) and £197/MWh (say £200/MWh) for round 3, and £104/MWh(say £105/MWh) for onshore.(11) By way of comparison the winter 2012 baseload strip is £53/MWh, which indicates the cost of offshore wind is about 3-4 times and onshore wind twice current power price. The implication of these costs and the possible ineffectiveness of windmills in mitigating CO2 emissions we identified above is, that the cost/ton of CO2 saved is above £200, which is truly extraordinary.
26. There is a story around that the effect of cycling of thermal plant due to wind variability will be mitigated by:-
•Rolling out smart meters which will regulate demand side response when the wind does not blow and thus prices are high
•An increase in smart appliances such as fridge/freezers and washing machines which will switch off when prices are high
•A major increase in electric vehicles which will have a price signal to charge when wind is blowing and prices are lower and can even feed back into the grid
•An increase in heat pumps which will respond to price
All of these factors may come into play when we have “smart grids” which are designed to not only provide, but also accommodate, the prospective new technology. This future requires not only extensive agreement on standards but also extensive trial and error experimentation to know how to implement the necessary systems and to modify the distribution networks. For at least the next decade – if not more - we will have to operate the systems largely as we do at the moment, and thus should assume that windmills may not mitigate CO2 as its proponents have suggested. Rather than splurge out with customer’s money big time on windmills (and uneconomic smart meters (12)) in the hope of quick structural changes in the behaviour of the operation of the electric system, we should proceed in an evolutionary manner and check reality against political visions – and counter the straightforward naked commercial vested interests that masquerade as being concerned with “the public interest” (13).
27. We met with Minister Charles Hendry on 16 May and provided him with the empirical data that indicate that in a thermal system windmills do not achieve what they claim on the tin. We most strongly recommend that before spending £ tens of billions more on windmills, DECC should commission an objective and scientific study of how efficient windmills are at mitigating CO2 emissions. We italicize “objective and scientific” (14) to differentiate from some of the glib and clearly politicized Impact Assessments prepared by DECC.
Notes.
1) Statistical Survey 2011, Paul-Frederik Bach, http://pfbach.dk/firma_pfb/statistical_survey_2011.pdf.
-
2)Wind Energy, The Case of Danmark, Hugh Sharman CEPOS 2009 www.cepos.dk
-
3) The topic of the significant loss of thermal efficiency of gas and coal plants cycling is dealt with in detail by Willem Post in “Wind Power and CO2 Emissions”,
www.coalitionforenergysolutions.org/research_and_reports.
4) Wind energy and CO2 emissions – 2, F. Udo, 21 October 2011, www.clepair.net
-
5)Curtailment in the Irish Power system, F. Udo 2012 http://www.clepair.net/Udo-curtail201205.html
-
6) Wind turbines as a source of electricity. F. Udo, K de Groot and C. le Pair: http://www.clepair.net/windstroom e.html
-
7) How less became more: wind, power and unintended consequences in the Colorado Energy Market, Bentek Energy LLC, 16 April 2010, http://docs.wind-watch.org/BENTEK-How-Less-Became-More.pdf.
8) Note that although it is conventional to calculate and compare levelised cost estimates for different generation technologies, the comparison favours windmills (and solar panels) because unlike nuclear and dispatchable thermal plants there is no guarantee that windmills will be producing at times of system stress. Estimates put the value of wind electricity at half the value of electricity produced by dispatchable sources.
9) Department of Energy and Climate Change, Review of the generation costs and deployment potential of renewable electricity technologies in the UK, Study Report, Arup, October 2011,
http://www.decc.gov.uk/assets/decc/11/consultation/ro-banding/3237-cons-ro-banding-arup-report.pdf.
10) ENSG ‘Our Electricity Transmission Network: A Vision For 2020’, 11D/954, February 2012,
http://www.decc.gov.uk/assets/decc/11/meeting-energy-demand/future-elec-network/4263-ensgFull.pdf.
11) The calculations are available from “The collapse of the Coalition electricity policies”, available on request from alexhenney@aol.com.
-
12)See “A critique of the impact assessment (IA) of smart meter roll-out for the domestic sector (GB) 18/07/2011”, Alex Henney, EEE Ltd, March 2012, available www.alexhenney.com.
-
13) This subject is extensively discussed in a report by Gordon Hughes: Why is wind power so expensive? Global Warming Policy Foundation 2012.
-
14)While National Grid should be involved in the study, it should not lead it because it has a vested interest in claiming that windmills mitigate CO2 because it wants as many windmills on the system as possible in order to justify bulking up its grids. An example of the reaction of vested interests is given by the response of Mr. Nick Winser to Mr. Udo’s analysis of Ireland was “Thanks. Interesting. I doubt that your point about part loaded fossil negating the carbon benefits of wind is well founded particularly with our huge advances in wind forecasting accuracy.” There is a basic flaw in his response, namely although the forecasts may be more accurate that per se will not alter the outturn variability – hence cycling of plant.